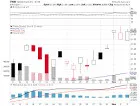
The Taiwan Fund, Inc.
NYSE:TWN
31.91 (USD) • At close April 28, 2025
Overview | Financials
Numbers are in millions (except for per share data and ratios) USD.
| 2024 | 2023 | 2022 | 2021 | 2020 | 2019 | 2018 | 2017 | 2016 | 2015 | 2014 | 2013 | 2012 | |
|---|---|---|---|---|---|---|---|---|---|---|---|---|---|
| Revenue
| 99.703 | 5.426 | -71.74 | 131.769 | 74.59 | -3.548 | -0.57 | 37.854 | -1.15 | 3.524 | 3.825 | 4.156 | 4.984 |
| Cost of Revenue
| 0 | 1.856 | 2.23 | 3.336 | 2.526 | 2.149 | 2.022 | 1.813 | 1.552 | 0 | 0 | 0 | 0 |
| Gross Profit
| 99.703 | 3.57 | -73.97 | 128.433 | 72.064 | -5.697 | -2.592 | 36.041 | -2.702 | 3.524 | 3.825 | 4.156 | 4.984 |
| Gross Profit Ratio
| 1 | 0.658 | 1.031 | 0.975 | 0.966 | 1.606 | 4.549 | 0.952 | 2.349 | 1 | 1 | 1 | 1 |
| Reseach & Development Expenses
| 0 | 0 | 0 | 0 | 0 | 0 | -0 | 0 | -0 | 0 | 0 | 0 | 0 |
| General & Administrative Expenses
| 1.434 | 1.45 | 1.548 | 1.227 | 1.264 | 1.458 | 1.5 | 1.428 | 2.703 | 2.717 | 2.937 | 2.631 | 4.273 |
| Selling & Marketing Expenses
| 0 | 0 | 0 | 0 | 0 | 0 | 0 | 0 | 0 | 0.075 | 0.076 | 0.079 | 0.067 |
| SG&A
| 1.434 | 1.45 | 1.548 | 1.227 | 1.264 | 1.458 | 1.5 | 1.428 | -0 | 2.792 | 3.013 | 2.711 | 4.34 |
| Other Expenses
| 1.092 | 0 | 1.042 | 0.912 | 0.821 | 1.104 | 1.39 | 1.165 | 8.224 | 0 | 0 | 0 | 0 |
| Operating Expenses
| 2.526 | 2.441 | 2.59 | 2.139 | 2.084 | 2.562 | 2.889 | 2.594 | 21.414 | 28.816 | 22.019 | 12.297 | 66.144 |
| Operating Income
| 97.177 | 73.879 | -74.33 | 129.63 | 72.505 | -6.11 | -3.459 | 35.261 | 0.924 | 0.578 | 0.69 | 1.118 | 0.351 |
| Operating Income Ratio
| 0.975 | 13.616 | 1.036 | 0.984 | 0.972 | 1.722 | 6.071 | 0.931 | -0.803 | 0.164 | 0.18 | 0.269 | 0.07 |
| Total Other Income Expenses Net
| 0 | -1.234 | 0 | 0 | 72.018 | 0 | 0 | 33.526 | 24.191 | -25.871 | 0.087 | 0.876 | 4.206 |
| Income Before Tax
| 97.177 | 72.645 | -74.33 | 129.63 | 72.505 | -6.11 | -3.459 | 35.261 | 25.239 | -25.292 | 25.844 | 16.453 | -61.16 |
| Income Before Tax Ratio
| 0.975 | 13.388 | 1.036 | 0.984 | 0.972 | 1.722 | 6.071 | 0.931 | -21.939 | -7.176 | 6.756 | 3.959 | -12.272 |
| Income Tax Expense
| 0 | 0 | -0.414 | 0.95 | 1.41 | 1.506 | -0.161 | 35.104 | 25.07 | -25.871 | 25.154 | 15.335 | -61.51 |
| Net Income
| 97.177 | 72.645 | -74.33 | 129.63 | 72.505 | -6.11 | -3.459 | 35.261 | 25.07 | -25.292 | 25.844 | 16.453 | -61.16 |
| Net Income Ratio
| 0.975 | 13.388 | 1.036 | 0.984 | 0.972 | 1.722 | 6.071 | 0.931 | -21.792 | -7.176 | 6.756 | 3.959 | -12.272 |
| EPS
| 13.56 | 9.73 | -9.95 | 17.36 | 9.71 | -0.8 | -0.43 | 4.3 | 0.99 | -3.08 | 3.14 | 2 | -6.81 |
| EPS Diluted
| 13.56 | 9.73 | -9.95 | 17.36 | 9.71 | -0.8 | -0.43 | 4.3 | 8,169,323 | -3.08 | 3.14 | 2 | -6.81 |
| EBITDA
| 0 | 0 | -73.915 | 128.68 | 0 | -6.11 | -3.338 | 0 | 0 | -24.968 | 25.154 | 15.335 | -61.51 |
| EBITDA Ratio
| 0 | 0 | 1.03 | 0.977 | 0 | 1.722 | 5.859 | 0 | 0 | -7.084 | 6.575 | 3.69 | -12.342 |