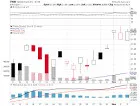
The Taiwan Fund, Inc.
NYSE:TWN
32.21 (USD) • At close April 29, 2025
Overview | Financials
Numbers are in millions (except for per share data and ratios) USD.
| 2024 | 2023 | 2022 | 2021 | 2020 | 2019 | 2018 | 2017 | 2016 | 2015 | 2014 | 2013 | 2012 | |
|---|---|---|---|---|---|---|---|---|---|---|---|---|---|
| Assets: | |||||||||||||
| Current Assets: | |||||||||||||
| Cash & Cash Equivalents
| 46.734 | 31.616 | 0.214 | 0.408 | 0.915 | 0.364 | 0.423 | 0.428 | 2.368 | 5.252 | 1.594 | 8.664 | 4.263 |
| Short Term Investments
| 0 | 0 | 0 | 0 | 0 | 0 | 0 | 0 | 0 | 0 | 0 | 0 | 0 |
| Cash and Short Term Investments
| 46.734 | 31.616 | 0.214 | 0.408 | 0.915 | 0.364 | 0.423 | 0.428 | 2.368 | 5.252 | 1.594 | 8.664 | 4.263 |
| Net Receivables
| 2.342 | 3.044 | 1.381 | 12.358 | 0.629 | 2.84 | 2.194 | 0.793 | 2.523 | 2.001 | 2.054 | 0.722 | 0 |
| Inventory
| 0 | 0 | 0 | 28.008 | 14.026 | 20.52 | 6.71 | 0 | -0 | 0 | 0 | 0 | 0 |
| Other Current Assets
| -2.342 | 0.058 | 0.771 | 0.058 | 0.055 | 0.053 | 0.052 | 0.052 | 0.054 | 0.034 | 0.058 | 0.05 | 0 |
| Total Current Assets
| 46.734 | 34.718 | 2.309 | 12.765 | 1.544 | 3.204 | 2.616 | 1.221 | 4.945 | 7.287 | 3.707 | 9.437 | 6.308 |
| Non-Current Assets: | |||||||||||||
| Property, Plant & Equipment, Net
| 0 | 0 | 0 | 0 | 0 | 0 | 0 | 0 | 0 | 0 | 0 | 0 | 0 |
| Goodwill
| 0 | 0 | 0 | 0 | 0 | 0 | 0 | 0 | 0 | 0 | 0 | 0 | 0 |
| Intangible Assets
| 0 | 0 | 0 | 0 | 0 | 0 | 0 | 0 | 0 | 0 | 0 | 0 | 0 |
| Goodwill and Intangible Assets
| 0 | 0 | 0 | 0 | 0 | 0 | 0 | 0 | 0 | 0 | 0 | 0 | 0 |
| Long Term Investments
| 315.035 | 264.095 | 222.912 | 318.535 | 214.807 | 163.996 | 185.917 | 197.331 | 160.208 | 131.847 | 182.055 | 149.607 | 148.849 |
| Tax Assets
| 0 | 0 | 0 | 0 | 0 | 0 | 0 | 0 | 0 | 0 | 0 | 0 | 0 |
| Other Non-Current Assets
| -315.035 | -264.095 | -222.912 | -318.535 | -214.807 | -163.996 | -185.917 | -197.331 | 0 | 0 | 0 | 0 | -148.849 |
| Total Non-Current Assets
| 317.436 | 314.592 | 222.912 | 318.535 | 214.807 | 163.996 | 185.917 | 197.331 | 160.208 | 131.847 | 182.055 | 149.607 | 148.849 |
| Total Assets
| 364.169 | 298.813 | 225.278 | 331.358 | 216.406 | 167.251 | 188.586 | 198.604 | 165.153 | 139.134 | 185.762 | 159.044 | 155.157 |
| Liabilities & Equity: | |||||||||||||
| Current Liabilities: | |||||||||||||
| Account Payables
| 1.872 | 2.715 | 1.137 | 10.381 | 0.694 | 7.216 | 1.24 | 0.652 | 1.856 | 1.189 | 0.929 | 0 | 0 |
| Short Term Debt
| 0 | 0 | 0 | 0 | 0 | 0 | 0 | 0 | 0 | 0 | 0 | 0 | 0 |
| Tax Payables
| 0 | 0.002 | 0 | 0 | 0 | 0 | 0 | 0 | 0 | 0 | 0 | 0 | 0 |
| Deferred Revenue
| 0 | 0 | 0 | 0 | 0 | 0 | 0 | 0 | 0 | 0 | 0 | 0 | 0 |
| Other Current Liabilities
| -1.872 | -2.717 | -1.137 | -10.381 | -0.694 | -7.216 | -1.24 | -0.652 | 0.134 | 0.102 | 0.012 | 0.175 | 0 |
| Total Current Liabilities
| 0 | 2.717 | 1.137 | 10.381 | 0.694 | 7.216 | 1.24 | 0.652 | 1.99 | 1.291 | 0.942 | 0.175 | 0.165 |
| Non-Current Liabilities: | |||||||||||||
| Long Term Debt
| 0 | 0 | 0 | 0 | 0 | 0 | 0 | 0 | 0 | 0 | 0 | 0 | 0 |
| Deferred Revenue Non-Current
| 0 | 0 | 0 | 0 | 0 | 0 | 0 | 0 | 0 | 0 | 0 | 0 | 0 |
| Deferred Tax Liabilities Non-Current
| 0 | 0 | 0 | 0 | 0 | 0 | 0 | 0 | 0 | 0 | 0 | 0 | 0 |
| Other Non-Current Liabilities
| 0 | 0 | 0 | 0 | 0 | 0 | 0 | 0 | 2.272 | 0 | 0 | 0 | 0 |
| Total Non-Current Liabilities
| 0 | 0.745 | 1.137 | 11.443 | 1.45 | 7.546 | 1.638 | 1.033 | 2.272 | 0 | 0 | 0 | 0 |
| Total Liabilities
| 2.66 | 3.725 | 1.462 | 10.381 | 0.694 | 7.216 | 1.638 | 1.033 | 2.272 | 1.291 | 0.942 | 0.175 | 0.165 |
| Equity: | |||||||||||||
| Preferred Stock
| 0 | 0 | 0 | 0 | 0 | 0 | 0 | 0 | 0 | 0 | 0 | 0 | 0 |
| Common Stock
| 234.67 | 238.506 | 256.839 | 251.819 | 205.6 | 133.256 | 168.455 | 144.03 | 144.032 | 193.91 | 151.481 | 156.89 | 184.614 |
| Retained Earnings
| 126.84 | 56.582 | -33.023 | 68.097 | 9.356 | 26.449 | -17.623 | 4.012 | -0.13 | -56.268 | 33.053 | 1.799 | -30.02 |
| Accumulated Other Comprehensive Income/Loss
| 0 | 0 | -0 | 68.097 | 9.356 | 26.449 | 36.116 | 49.529 | 18.978 | -0 | -0 | 0 | 0 |
| Other Total Stockholders Equity
| 0 | 0 | 0 | -68.097 | -9.356 | -26.449 | -36.116 | -0 | 0 | 0 | 0 | 0 | -154.594 |
| Total Shareholders Equity
| 361.51 | 295.088 | 223.816 | 319.915 | 214.956 | 159.705 | 186.948 | 197.571 | 162.881 | 137.642 | 184.534 | 158.69 | 154.594 |
| Total Equity
| 361.51 | 295.088 | 223.816 | 319.915 | 214.956 | 159.705 | 186.948 | 197.571 | 162.881 | 137.642 | 184.534 | 158.69 | 154.594 |
| Total Liabilities & Shareholders Equity
| 364.169 | 298.813 | 225.278 | 331.358 | 216.406 | 167.251 | 188.586 | 198.604 | 165.153 | 138.933 | 185.476 | 158.865 | 0 |