Hotel Property Investments
ASX:HPI.AX
3.75 (AUD) • At close February 26, 2025
Overview | Financials
Numbers are in millions (except for per share data and ratios) AUD.
| 2024 | 2023 | 2022 | 2021 | 2020 | 2019 | 2018 | 2017 | 2016 | 2015 | 2014 | 2013 | |
|---|---|---|---|---|---|---|---|---|---|---|---|---|
| Operating Activities: | ||||||||||||
| Net Income
| 35.995 | 3.59 | 211.446 | 84.72 | 40.943 | 49.238 | 48.387 | 98.899 | 60.128 | 35.435 | 59.3 | 39.255 |
| Depreciation & Amortization
| 0.136 | 0.132 | 0.146 | 0.179 | 0.176 | 0.078 | 0.069 | 0.032 | 0 | 0 | 0 | 0 |
| Deferred Income Tax
| 0 | 0 | 41.054 | -2.995 | -3.342 | 0.035 | 0.078 | -0.454 | 0 | 0 | 0 | 0 |
| Stock Based Compensation
| 0.211 | 0.211 | 0.113 | 0.105 | 0.079 | -0.017 | 0.05 | 0.017 | 0 | 0 | 0 | 0 |
| Change In Working Capital
| 1.947 | 0.222 | 6.293 | -2.992 | -3.003 | -0.018 | -0.128 | 0.437 | -0.058 | 0.106 | -3.789 | 0.556 |
| Accounts Receivables
| 0 | 0.691 | 4.915 | -2.17 | -3.474 | -0.018 | -0.128 | 0.437 | -0.058 | 0.106 | -4.516 | 0.556 |
| Inventory
| 0 | 0 | 0 | 0 | 0 | 1.057 | -0.613 | 0.205 | -0.662 | 0 | 0 | 0 |
| Accounts Payables
| 0.655 | 0.935 | 36.544 | -0.362 | 0.563 | -0.796 | 0.467 | -0.24 | 0.315 | 0 | 0 | 0 |
| Other Working Capital
| 1.292 | -1.404 | -35.166 | -0.46 | -0.092 | -0.261 | 0.146 | 0.24 | -0.315 | -0.162 | 0.727 | -1.242 |
| Other Non Cash Items
| 28.681 | 58.655 | -195.684 | -35.591 | 5.163 | -8.268 | -6.381 | -60.398 | -22.603 | -10.948 | -32.905 | -15.581 |
| Operating Cash Flow
| 66.97 | 62.599 | 63.368 | 43.426 | 40.016 | 41.048 | 42.075 | 38.987 | 37.467 | 24.593 | 22.606 | 24.23 |
| Investing Activities: | ||||||||||||
| Investments In Property Plant And Equipment
| -0.05 | -0.033 | -5.011 | -0.062 | -0.005 | -0.01 | -0.003 | -0.348 | 0 | 0 | 0 | 0 |
| Acquisitions Net
| 0 | 0 | 175.788 | 0 | 0 | -12.897 | 0 | -9.385 | 0 | 0 | 0 | 0 |
| Purchases Of Investments
| -23.71 | -17.289 | -195.388 | -113.171 | -66.79 | -1.103 | -20.729 | -0.448 | -0.503 | -59.321 | -9.359 | 0 |
| Sales Maturities Of Investments
| 0 | 25.677 | 24.6 | 0 | 0 | 14 | 0 | 9.833 | 0.722 | 9.88 | 3.59 | 0 |
| Other Investing Activites
| 0 | 8.388 | -175.788 | -113.171 | -66.79 | 12.897 | -0.304 | -0.186 | 0.219 | -49.441 | -5.769 | 3.319 |
| Investing Cash Flow
| -23.76 | 8.355 | -175.799 | -113.233 | -66.795 | 12.887 | -20.732 | 9.037 | 0.219 | -49.441 | -5.769 | 3.319 |
| Financing Activities: | ||||||||||||
| Debt Repayment
| 19.9 | -35.413 | 103.282 | 62.004 | 35.224 | -25.985 | 9.006 | -1.411 | -4.5 | 27 | -11.192 | 0 |
| Common Stock Issued
| 0 | 0 | 57.403 | 46.812 | 29.109 | 0 | 263.054 | 31.809 | 0 | 29.382 | 0 | 0 |
| Common Stock Repurchased
| -0.287 | -0.112 | 0 | -0.198 | -0.168 | 0 | -0.304 | -0.186 | 0 | 0 | 0 | 0 |
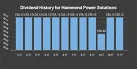
| Dividends Paid
| -34.084 | -35.193 | -31.005 | -26.73 | -24.401 | -28.604 | -28.76 | -46.009 | -25.422 | -23.235 | -12.901 | -13.882 |
| Other Financing Activities
| -28.853 | -0.101 | 40.452 | -12.622 | -12.491 | 0 | -0.876 | -1.366 | 0 | -7.072 | -5.154 | -12.617 |
| Financing Cash Flow
| -43.324 | -70.819 | 112.729 | 69.266 | 27.273 | -54.589 | -21.238 | -49.158 | -39.98 | 26.075 | -29.247 | -26.499 |
| Other Information: | ||||||||||||
| Effect Of Forex Changes On Cash
| 0 | -0.972 | 0 | 0 | 0 | 0 | 0 | 0 | 0.001 | 0 | 0 | 14.695 |
| Net Change In Cash
| -0.114 | 0.135 | 0.298 | -0.541 | 0.494 | -0.654 | 0.105 | -1.134 | -2.293 | 1.227 | -12.41 | 15.745 |
| Cash At End Of Period
| 0.858 | 0.972 | 0.837 | 0.539 | 1.08 | 0.586 | 1.24 | 1.135 | 2.269 | 4.562 | 3.335 | 15.745 |