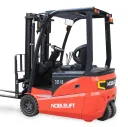
Noblelift Intelligent Equipment Co.,Ltd.
SSE:603611.SS
18.78 (CNY) • At close May 9, 2025
Overview | Financials
Numbers are in millions (except for per share data and ratios) CNY.
| 2024 | 2023 | 2022 | 2021 | 2020 | 2019 | 2018 | 2017 | 2016 | 2015 | 2014 | 2013 | 2012 | 2011 | |
|---|---|---|---|---|---|---|---|---|---|---|---|---|---|---|
| Revenue
| 6,978.633 | 6,962.774 | 6,702.217 | 5,886.978 | 4,077.055 | 3,087.252 | 2,552.635 | 2,119.601 | 1,309.756 | 1,149.089 | 1,205.889 | 1,120.991 | 1,208.99 | 1,304.843 |
| Cost of Revenue
| 5,386.491 | 5,419.952 | 5,345.6 | 4,741.836 | 3,135.532 | 2,362.592 | 1,939.247 | 1,613.015 | 950.11 | 881.858 | 954.861 | 885.546 | 987.496 | 1,100.681 |
| Gross Profit
| 1,592.141 | 1,542.822 | 1,356.617 | 1,145.142 | 941.523 | 724.661 | 613.388 | 506.586 | 359.645 | 267.231 | 251.029 | 235.445 | 221.494 | 204.161 |
| Gross Profit Ratio
| 0.228 | 0.222 | 0.202 | 0.195 | 0.231 | 0.235 | 0.24 | 0.239 | 0.275 | 0.233 | 0.208 | 0.21 | 0.183 | 0.156 |
| Reseach & Development Expenses
| 241.221 | 264.439 | 259.286 | 224.375 | 170.112 | 100.549 | 71.717 | 57.565 | 27.599 | 24.54 | 20.048 | 18.063 | 13.213 | 12.773 |
| General & Administrative Expenses
| 153.056 | 125.552 | 118.484 | 92.869 | 89.199 | 65.493 | 51.692 | 58.119 | 40.812 | 21.779 | 23.142 | 24.298 | 24.727 | 18.958 |
| Selling & Marketing Expenses
| 91.019 | 345.392 | 275.55 | 223.353 | 199.72 | 156.714 | 109.759 | 96.803 | 70.781 | 57.106 | 49.579 | 50.973 | 48.035 | 51.794 |
| SG&A
| 244.075 | 727.242 | 394.034 | 316.222 | 288.919 | 222.208 | 161.451 | 154.921 | 111.592 | 78.884 | 72.721 | 75.271 | 72.762 | 70.752 |
| Other Expenses
| 550.353 | 19.093 | 206.632 | 179.198 | 125.513 | 88.773 | -11.003 | 3.639 | 4.728 | 11.464 | -4.921 | 9.793 | 5.407 | 5.919 |
| Operating Expenses
| 1,035.65 | 1,010.774 | 859.952 | 719.795 | 584.544 | 411.529 | 326.287 | 275.232 | 207.813 | 158.538 | 135.936 | 138.284 | 132.729 | 118.259 |
| Operating Income
| 556.492 | 532.048 | 457.279 | 342.307 | 282.941 | 278.458 | 239.982 | 203.023 | 168.879 | 127.649 | 93.808 | 92.351 | 79.554 | 81.965 |
| Operating Income Ratio
| 0.08 | 0.076 | 0.068 | 0.058 | 0.069 | 0.09 | 0.094 | 0.096 | 0.129 | 0.111 | 0.078 | 0.082 | 0.066 | 0.063 |
| Total Other Income Expenses Net
| -16.185 | -3.807 | -5.809 | -2.773 | 0.55 | 2.592 | -1.017 | -0.141 | 8.279 | 6.675 | 4.682 | 9.771 | 1.933 | -0.227 |
| Income Before Tax
| 540.307 | 528.241 | 451.47 | 339.535 | 283.49 | 281.05 | 238.964 | 202.633 | 177.511 | 134.324 | 100.571 | 102.122 | 84.959 | 87.807 |
| Income Before Tax Ratio
| 0.077 | 0.076 | 0.067 | 0.058 | 0.07 | 0.091 | 0.094 | 0.096 | 0.136 | 0.117 | 0.083 | 0.091 | 0.07 | 0.067 |
| Income Tax Expense
| 75.306 | 67.097 | 66.9 | 45.831 | 43.736 | 33.817 | 39.379 | 36.242 | 32.322 | 25.068 | 17.336 | 16.382 | 12.792 | 12.455 |
| Net Income
| 461.907 | 457.749 | 402.185 | 300.216 | 242.393 | 242.28 | 188.389 | 159.504 | 144.843 | 107.197 | 82.34 | 85.946 | 71.989 | 75.009 |
| Net Income Ratio
| 0.066 | 0.066 | 0.06 | 0.051 | 0.059 | 0.078 | 0.074 | 0.075 | 0.111 | 0.093 | 0.068 | 0.077 | 0.06 | 0.057 |
| EPS
| 1.79 | 1.78 | 1.56 | 1.17 | 0.94 | 0.93 | 0.72 | 0.62 | 0.65 | 0.49 | 0.49 | 0.51 | 0.43 | 0.46 |
| EPS Diluted
| 1.79 | 1.78 | 1.56 | 1.17 | 0.94 | 0.93 | 0.71 | 0.61 | 0.65 | 0.49 | 0.49 | 0.51 | 0.43 | 0.46 |
| EBITDA
| 724.777 | 724.214 | 651.392 | 507.176 | 408.773 | 360.186 | 295.029 | 248.47 | 213.542 | 168.891 | 135.001 | 130.475 | 114.103 | 114.729 |
| EBITDA Ratio
| 0.104 | 0.104 | 0.097 | 0.086 | 0.1 | 0.117 | 0.116 | 0.117 | 0.163 | 0.147 | 0.112 | 0.116 | 0.094 | 0.088 |